


Large tonnage water cooled chillers are highly efficient, complicated machines and consume a lot of power. Each chiller is a compromise selection of heat exchangers, compressors with motors, and refrigerants to match the specific requirements of the customer. The complexity and customized aspect of these chillers makes nearly each one unique. Adding to that the geographic location and operating conditions (load and weather) for each installation insures that the owner has ‘one of a kind’ operation.
Therefore the chiller is difficult (if not impossible) to asses for operating efficiency and operational degradation on a timely basis. Periodic diagnostic checks are difficult to interpret and may include complicated sampling and lab tests of the refrigerant to show system degradation.
This new chiller model can readily be customized to match any chiller and uses the same conditions as the actual chiller to produce real time results. The model generates unique and accurate benchmark metrics. Consequently the operator can visually compare real time operating data points to metrics that represent the chillers as new or original as designed specifications. The operator / owner will be encouraged to implement energy saving strategies as the results are immediately available for analysis.
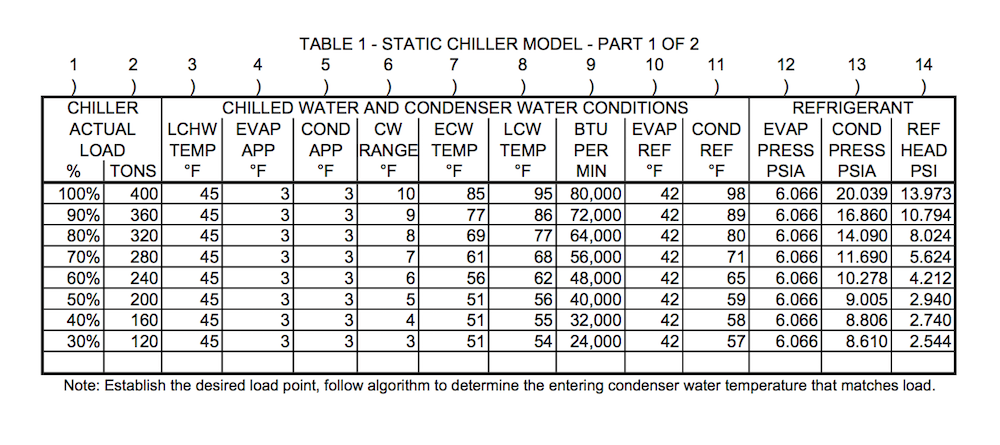
A static description of the model is shown in the attached table 1 and table 2. The chiller at any time is operating under given set of conditions which continuously vary in real time. These include load, entering and leaving water temperatures and flow rates of the evaporator and condenser as well as refrigerant temperatures, pressures at different points and the refrigerant flow rate.
The flow rate of refrigerant is calculated using a proprietary method. The result is a set of parameters that can be compared to the actual operating parameters in real time. Several primary metrics can be readily obtained and displayed for immediate analysis. Also many other metrics such as temperatures and pressures can be generated and compared as needed.
Currently there is no good way to benchmark chiller operations. ASHRAE Guideline 22-2012 recommends a large list of system static measurements and data tabulation for after the fact analysis and / or charting by an expert engineer. But this does not provide benchmarks only trends.
A static customized model can be produced in a spread sheet. From the spread sheet model regression formulas are produced for use by existing control system provided by a number of current automation and control vendors for chiller plants.
Chart 1 shows a load versus condenser water temperature curve for a specific chiller. This developed curve is represented by a formula that will be used by the Chiller Plant Optimizer™ in place of the original generic formula. The Chiller Plant Optimizer is described in Patent # US 6,718,779 to Henry dated April 13, 2004.
Similar curves to calculate efficiency and other operational modes including benchmark metrics are the subject of my current pending patent where the methods described above are fully exposed.
A next step is to implement a dynamic model.
Like this entry?
-
About the Entrant
- Name:William R Henry
- Type of entry:individual
- Software used for this entry:Microsoft Excel, NIST Reference Fluid Thermodynamic and Transport Properties (REFPROP)
- Patent status:pending