


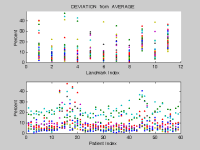
Shape state analysis offers vital insights. Structures change shape before collapsing. Earthquakes are preceded by shifts in relative locations of monitoring stations. Genetic abnormalities can be detected and quantified from locations of anatomical features recognizable to specialists. These and other applications rely on comparing arrays of physical landmarks. Applicable arrays can be in any regular or irregular shape as long as 1) the landmarks reasonably characterize the entity being scrutinized, 2) the representation is uniform for all samples (frames, patients, ...), 3) some minimal degree of consistency holds. In a medical application the second condition requires a complete landmark set for every patient and, though groups can contain all ages/sizes/races ... and substantial abnormalities may be present, the third condition steers attention into areas related to some specific physiological function. Herein, for example, results are shown for windpipes (fourteen landmarks on each of twenty patients and for palates (eleven landmarks on each of fifty-nine patients).
Because the method used owes its genesis to medical imaging, that operation is a key part of this discussion. A pioneering development from over two decades ago, though brilliant and highly significant, produced just marginal results. Submitted here is a relatively recent extension of that 2-dimensional work to 3D, with dramatically better performance. Two of the areas mentioned (medical imaging and earthquake warning) have produced success with real-world data and the other (infrastructure collapse) is preventable via detection by repetitive computation (all day every day) applied to measurements strategically placed (and already existing in many locations) -- reinforcement could then be added only where need is indicated.
RESULTS
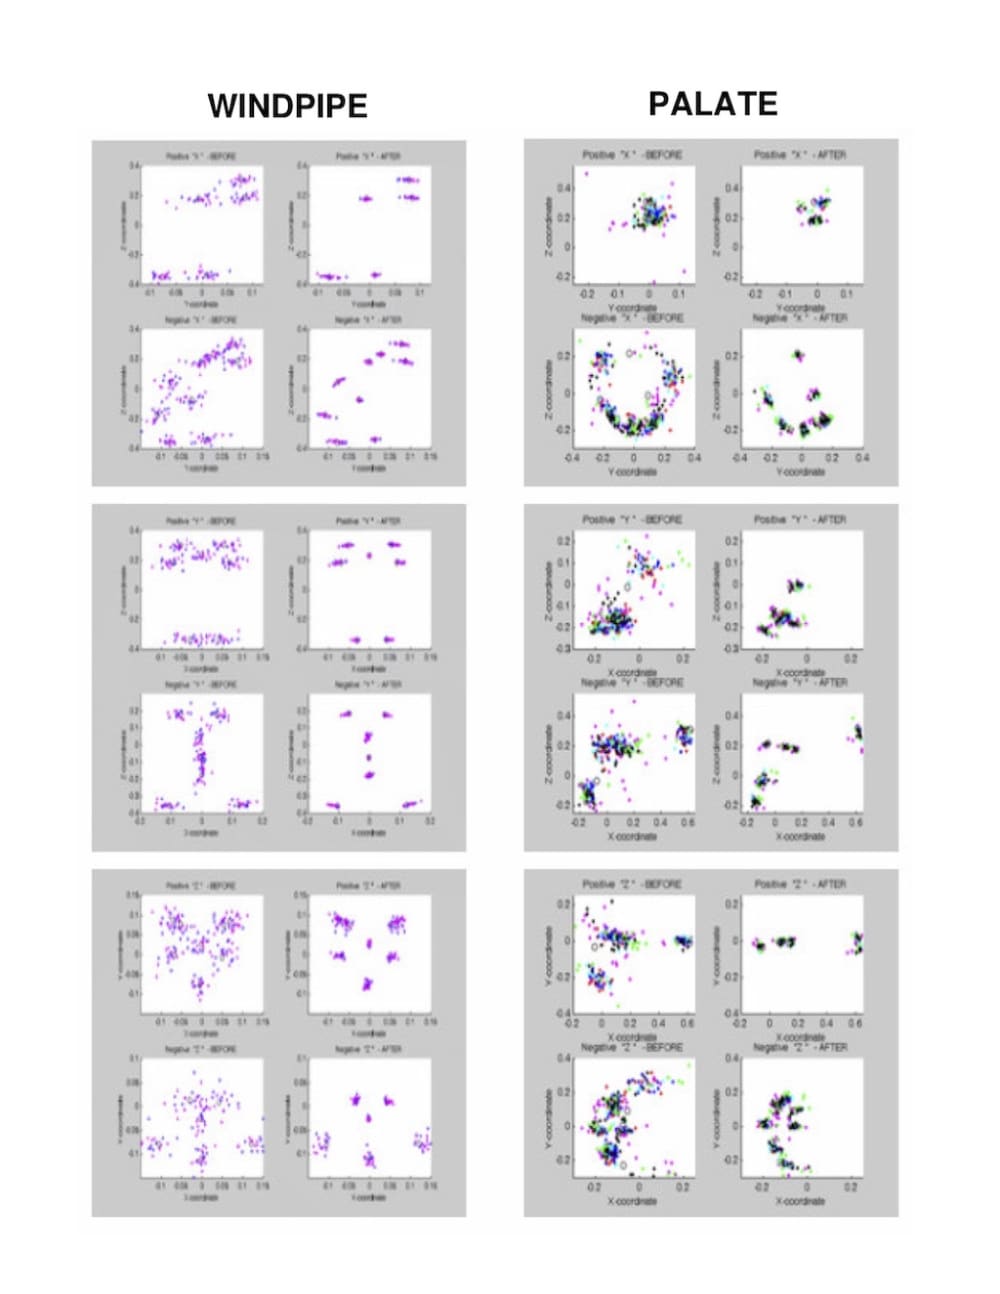
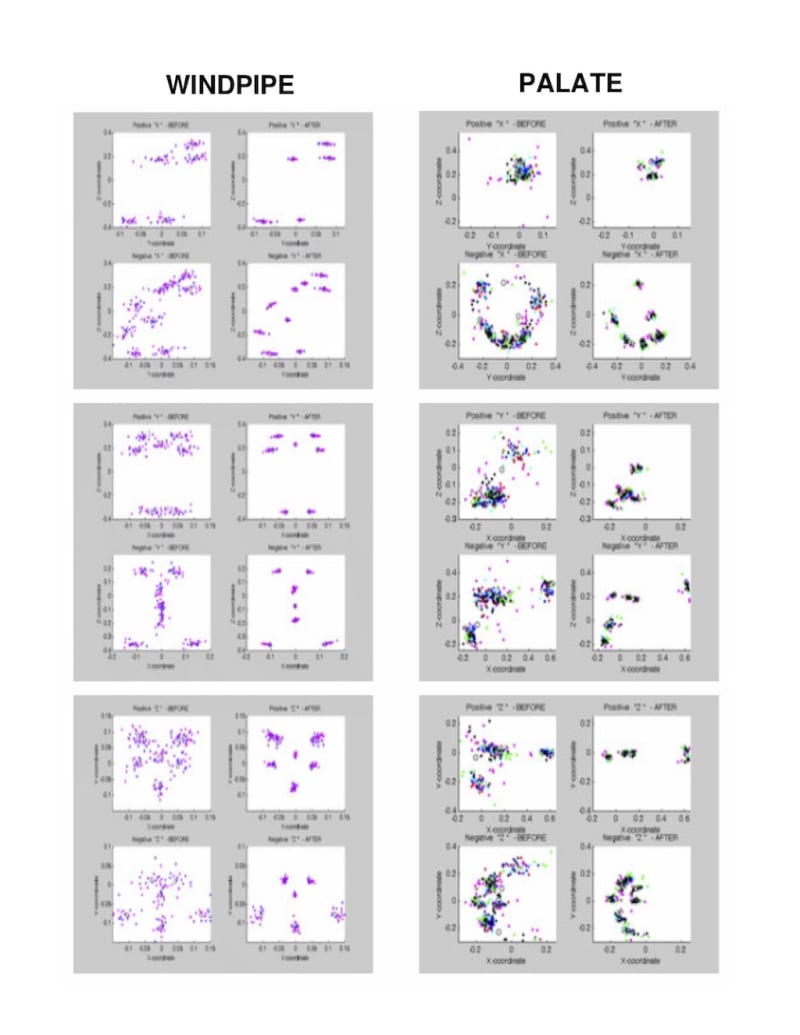
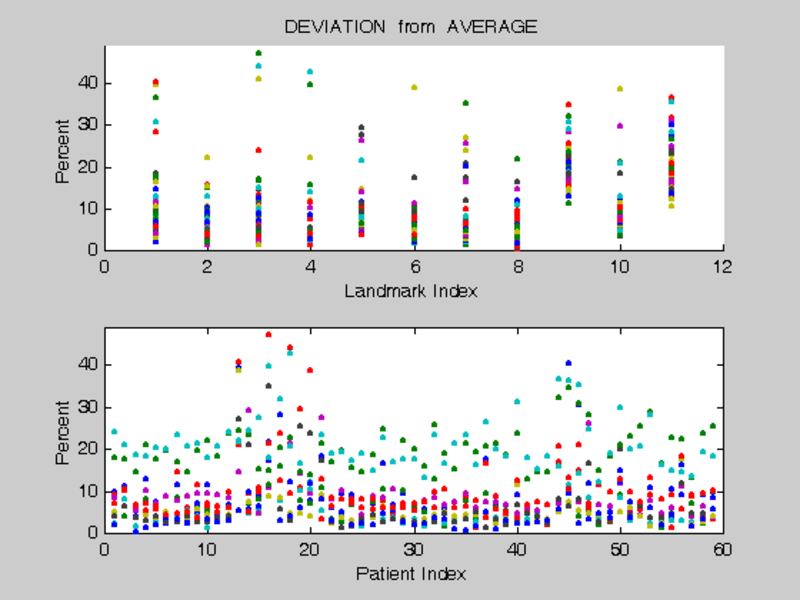
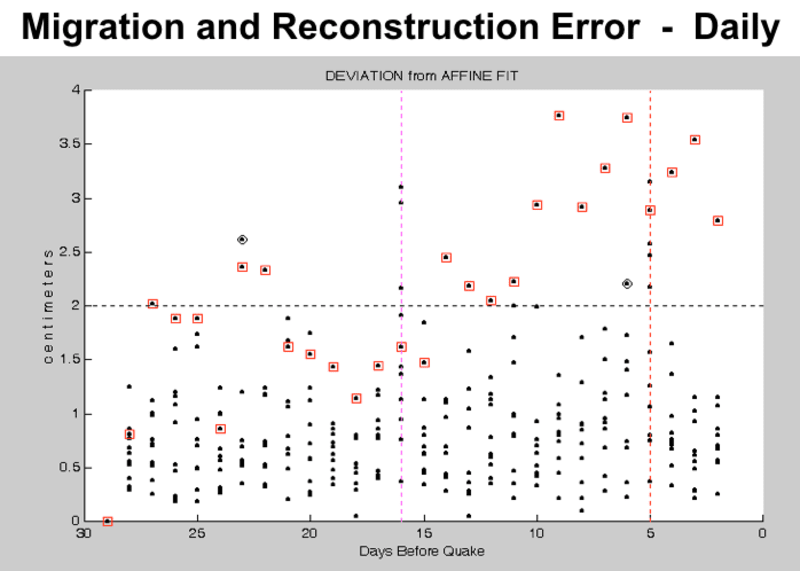
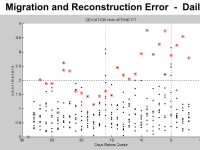
Excerpts from https://www.ion.org/publications/abstract.cfm?articleID=15257 show windpipe and palate landmark views before and after extracting computed deformations; convergence is quite evident. That first visual illustration is followed by a second, with a plot of deviations-from-average for all patients vs landmark index, and for all landmarks vs patient index. The last visual illustration indicates beyond-dispersion model deviations FIVE DAYS before the Tohoku quake ONLY on pre-shock days or at the station nearest epicenter.
Links for further inquiry include a preview of the anatomy application video ( https://www.dropbox.com/s/8mp1asrxph237fe/3Dmed.mp4?dl=0 ) plus additional references addressing application to warnings for earthquake or infrastructure disturbance:
* https://youtu.be/psi6PSarJ-0
* http://mycoordinates.org/earthquake-analysis-by-3-d-affine-deformations/
* 1st video on http://jameslfarrell.com/online-training-courses
The last link offers a free preview (click inside white circle).
Years after these developments and publications, almost no one understands. Medical imaging uses 3D but deformation analysis is conducted largely in 2D. Earthquakes, while known to show pre-shocks in time, are considered impossible to locate in advance. Despite thousands of bridges with questionable structural integrity, infrastructure progress continues to lag. Nevertheless the commercial value of this program in any one field, let alone all three noted, is enormous. Far greater yet is potential benefit to people who could escape danger or injury through further refinement followed by widespread application.
Like this entry?
-
About the Entrant
- Name:James Farrell
- Type of entry:individual
- Patent status:none